Customizing net worth over time reports to show daily amounts
The incoming & spending/net worth over time reports (introduced sometime near the 2002 or 2003 versions)
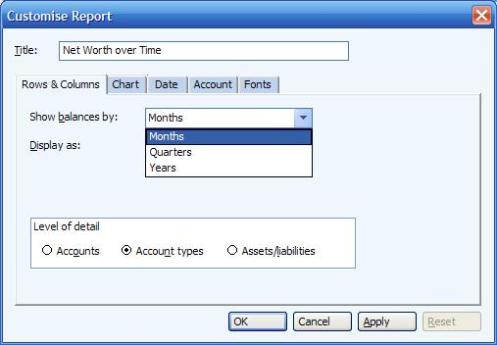
can be customized to show a graph based on specific time intervals. These are monthly, quarterly and yearly - this can be
seen on the image on this page.
It is not possible to make this daily or weekly. This would be quite nice to have, but given that Microsoft Money can run particularly slowly, calculating everything for each day would make Money run even more slowly. This is because the system will calculate investment values based on the last price available (which may not be the particular day's price), currency conversions and account values for each day. The number of calculations could be excessively large.
However, if this is something you desperately want, then why not try using a Microsoft Excel spreadsheet - use MoneyLink (see
Article 30 to import data using the 'account transactions for all accounts' import option, and then generate a graph based on that.