Price History and/or investment details graph do not show all transaction activities
When you enter an investment transaction, Money writes an entry into the stock's price history.
This investment might say 'Buy' or 'Sell' for example.
If you subsequently download the latest stock prices
or delete these entries in the price history, then the price history or the investment details graph (or a custom version)
may not show the information about your investment purchases. Money only shows the information on the graph if there is an
entry in the price history which tells it to.
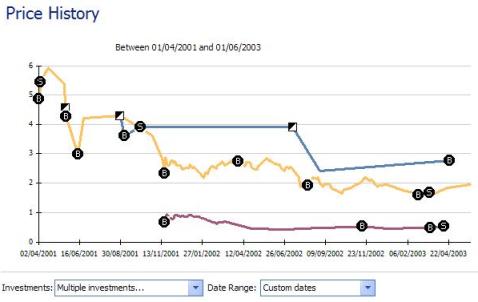
An example of this view is shown in the image below. It is a
customized view showing buys and sells (as well as stock splits), which illustrates the activities.
Money 2005 also seems to override manual transaction prices with 'Online' ones. (See
Article 142)
A slightly cumbersome way to get these entries in the Price History showing for all transactions is to first manually delete the 'online' entry by using the 'Update Prices' -> 'Update Prices Manually' option in the portfolio, and then select the investment. Remove the entries on the dates you want your transaction prices to be shown. Then go to the transactions in question, and put a couple of spaces after the price and just press enter on those investment transactions again (you won't have to change the transaction, just press enter again on it). This seems to rewrite the 'Buy' or 'Sell' label again.
Once you've done this, the price history graph within the investment should show the label indicating the investment activity.
There is also an option to turn these on and off, so if the history shows the actions, then you may need this:
- Right click on an investment in the portfolio and choose "See Price History"
- Right click on the chart and choose "Zoom". This shows the report options.
- Click "Customize" in the upper left corner
- On the "Chart" tab, check the "Mark Events" option
The final part of this article is based on a posting to the newsgroup by Scott Tyler
Keywords: graph, history, investment