Using patterns for chart views
It is possible to view charts using 'patterns'. This is the way that the program basically means black and white
with various patterned methods of distinguishing data.
This option has been in Money for a long time, and isn't really
used that much. However, if you need high contrast pictures, then it might be an option you need to select.
To turn this
option on, first go to Tools->Settings->Program Settings.
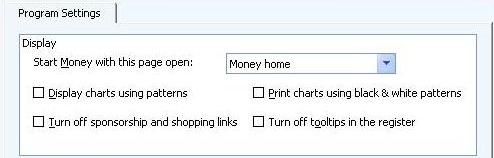
Select the 'display charts using patterns' option, and press the 'Next' option at the bottom of the window.
That's all you need to do.
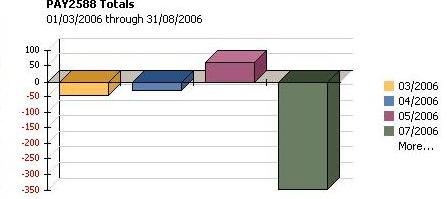
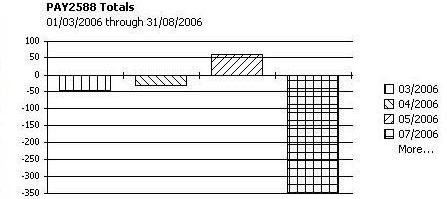
To see the results, compare the two bar charts as seen below. The first is the
colored one, and the second is the black and white (patterned) one.