What is contained in a Money monthly report
Money automatically generates a monthly report on your transactions and Money file each month. This report is
dynamically generated, and contains the following sections.
Spending
Income versus Expenses
This contains a summary
of income against expenses over the month of the report, and the previous month. The difference between the income and expenses is
recorded as 'potential savings'. A negative number implies more expenses than income. A summary of this is provided, giving you
information on the difference between incomes in each month also.
Monthly Expenses Compared
Taking the previous month and
the current month, pie charts (can be customized to show bar or line charts) are shown with the top spending categories. The
same categories are colored the same on each pie chart. A summary of major increases and decreases in spending is shown.

Top Five Expense Categories
The top five categories in each month are shown. These will not necessarily correlate.
Net Worth
Current Net Worth
A bar chart similar to the default current net worth report is shown. A summary
of increase/decrese in net worth is seen below it.
Debt Reduction Progress
A summary of accounts in the debt plan,
plus dates when they will be out of debt, based on the figures in the Debt Reduction Planner.
Expert Assistant/Advisor FYI
The report shows all of the expert assistant or advisor FYI messages received during the month of the report are summarized here.
It is a useful place to see them as if you miss them during the course of a month, you can see them here.
In addition, it will show those investments which have not have their prices updated for a while.
Investment Performance
A bar chart of the performance of your investments, grouped by Investment Account. This is supplemented by a summary of best and
worst performers, a percentage breakdown of assets into Bonds, Shares etc., certain investment movements and a summary of
investments bought or sold in the month in question.
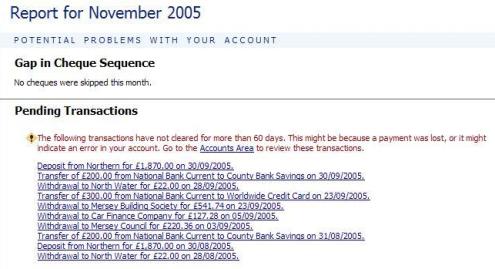
Potential problems with your account
The report looks for gaps
in your check sequence and pending transactions.
Next Month
A cash flow forecast chart is shown, showing the forecast over the next twelve months. The report also
shows occasional bills, deposits and transfers for the following month, so you can plan for them if required. These bills
show who they are paid to, the date and for how much.
Frequent Flyer Programs
Finally, the report will show frequent
flyer programs, including points/miles balances and how many points or miles you have recorded this month.